Learning analytics
Active students, completions and quizzes over time.
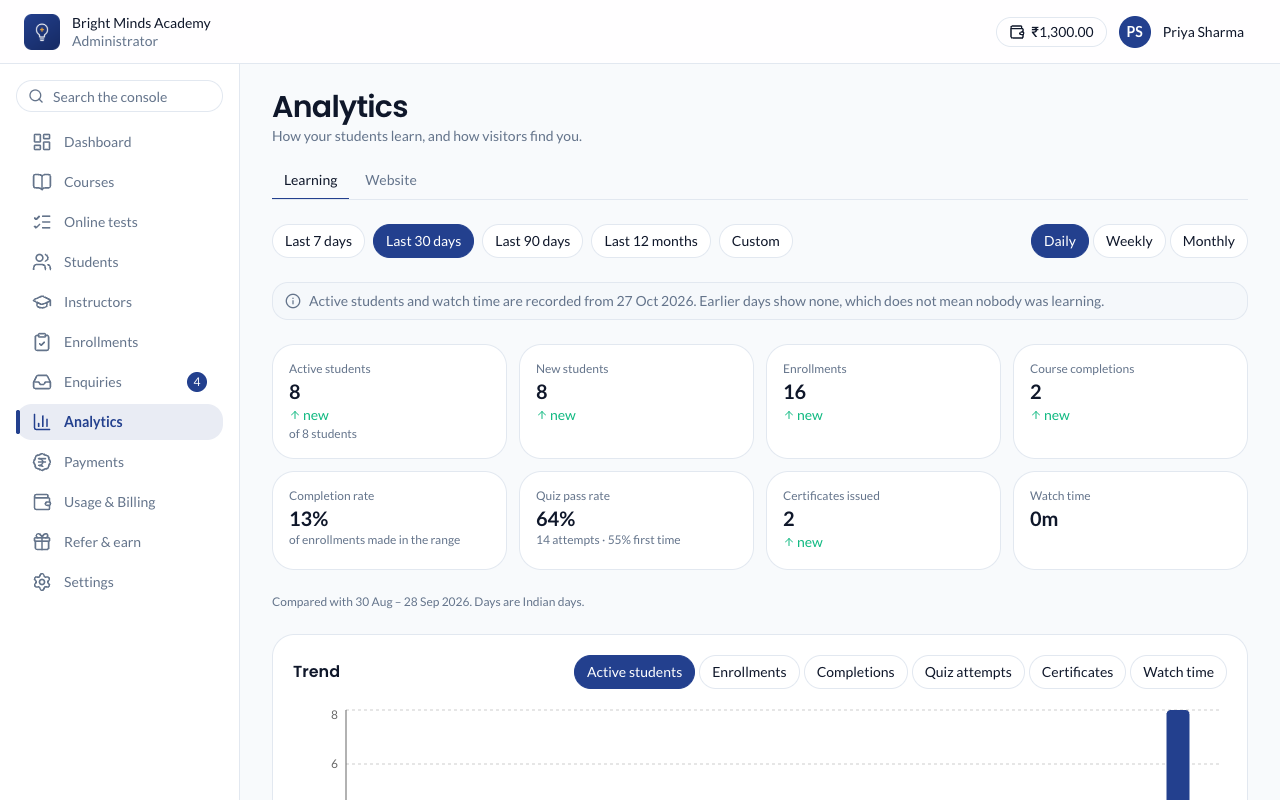
Learning analytics shows how your students are studying over a period you choose: how many are active, how many finish, how quizzes go, and how much video they watch.
Open learning analytics
- In the left menu, click Analytics.
- The Learning tab opens first.
Choose the dates
At the top, pick a period: Last 7 days, Last 30 days (the default), Last 90 days, Last 12 months, or Custom to enter your own dates.
Next to the dates, choose how the chart groups them: Daily, Weekly or Monthly. Paatya picks a sensible one for the period, and you can change it.
All days are Indian days (IST).
The figures
Each figure is compared with the period of the same length just before it, so you can see whether things are going up or down.
| Figure | What it means |
|---|---|
| Active students | Students who signed in or studied at least once in the period. "of N students" shows how many active accounts you have in all. |
| New students | Active students who joined your academy during the period. |
| Enrollments | Enrollments made during the period. |
| Course completions | Courses finished during the period, whenever the student started. |
| Completion rate | Of the enrollments made during the period, the share that are finished by now. |
| Quiz pass rate | Of the quiz attempts submitted, the share that passed. The first-attempt pass rate is shown too. |
| Certificates issued | Certificates earned during the period. |
| Watch time | Total video time watched. Skipping ahead and rewinding don't add to it. |
Note: "Active students" and "Watch time" have only been recorded since this tracking started. If your period reaches back before that date, the page tells you, and earlier days show as zero.
The trend chart
Pick what to chart: Active students, Enrollments, Completions, Quiz attempts, Certificates or Watch time. Each bar is one day, week or month.
The courses table
One row for each course. Click a column heading to sort by it.
| Column | Counts |
|---|---|
| Enrolled, Completed, Quiz pass, Certificates | Within the period you chose. |
| Completion | Across all enrollments on the course, ever. |
| Watch time | All time. |
Tip: Sort by Completion to find the course students struggle to finish, then open its Course health page to see exactly where they stop.
If something goes wrong
- Every figure is zero. Check the dates. Nothing is counted until students start signing in and studying.
- The numbers don't match the Dashboard. They measure different things. The dashboard counts all active accounts and all-time totals. Learning analytics counts what happened within your dates.