Test results
Every student's best score, ranked, with categories, and a download.
The results page shows how every student did on one test: who came first, how the scores spread, and how the class did in each category.
Open the results
- On the Tests page, click the test's ⋮ menu, then Results.
- Or open the test and click Results at the top.
What you'll see
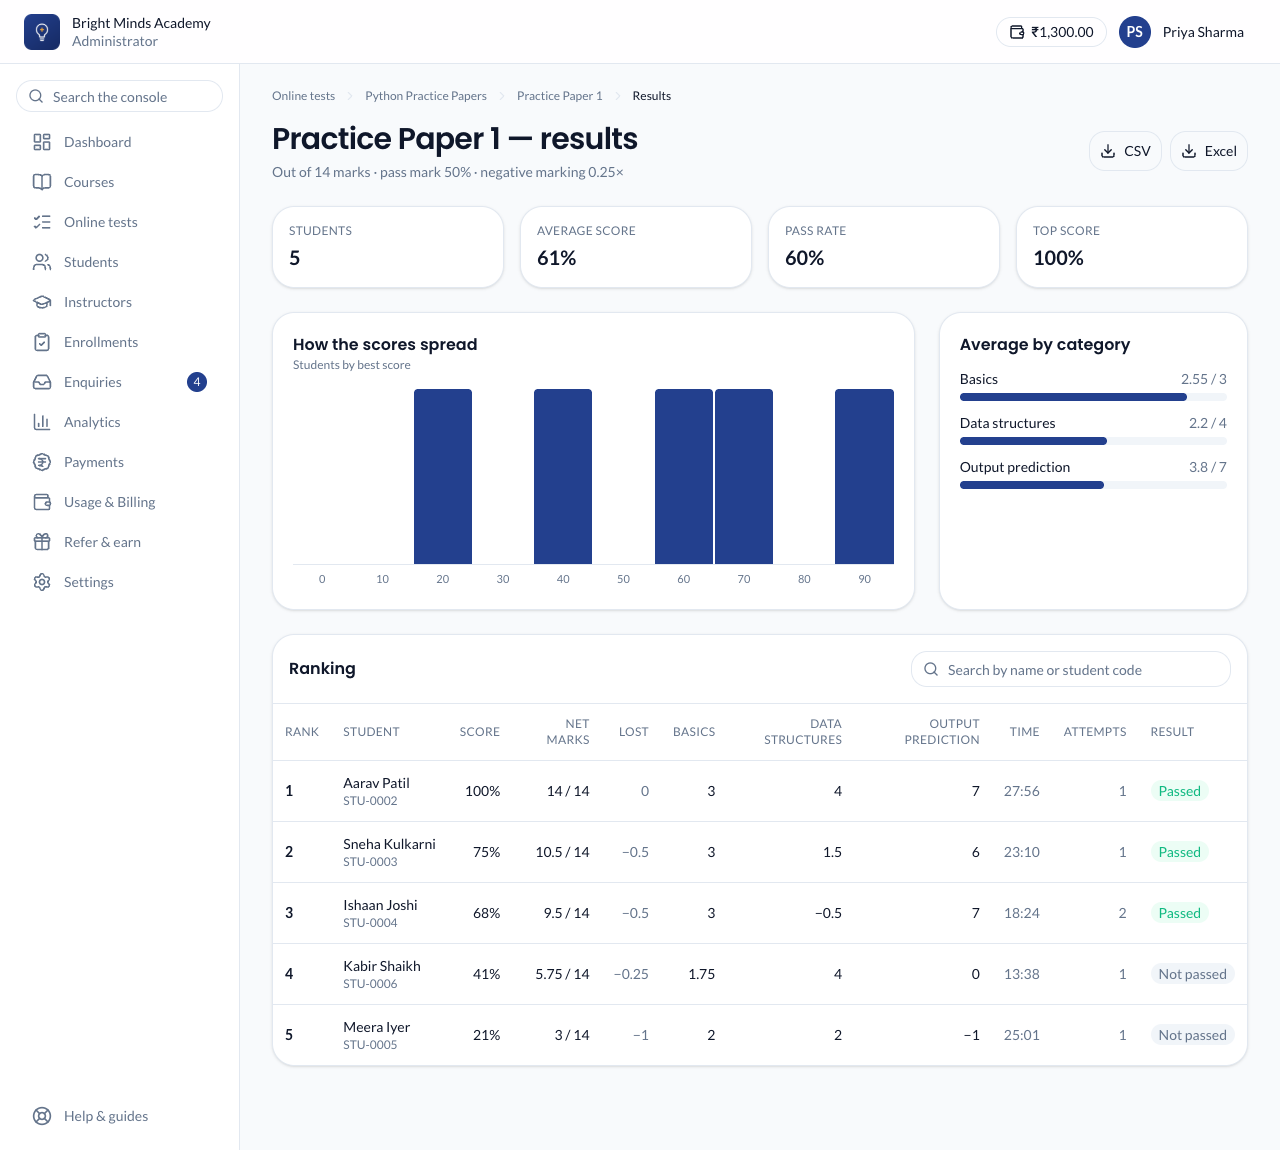
- Students, average score, pass rate and top score across the top.
- How the scores spread: how many students scored 0–9%, 10–19% and so on up to 90–100%. Point at a bar to see the number.
- Average by category, when the test has categories: the class's average marks in each, out of what the category is worth.
- Ranking: every student who has taken it, best first.
Each student appears once, with their best attempt. They're ranked by score, then by marks, then by who was quicker. Students level on all three share a rank. The table shows each student's score, marks out of the total, the marks they lost to negative marking (if the test uses it), their marks in each category, the time they took, how many attempts they used, and whether they passed.
Click a student's name to see all their quiz results, and open any attempt answer by answer.
Download the results
Click CSV or Excel at the top. The file has one row per student, in rank order, with the same columns as the table.
Related
- Create an online test
- Student details: one student's results across every course.